
Bloom Minds Explorer
An interactive 3D visualization platform that leverages NASA GIBS data to track vegetation changes and flowering events in real-time
NASA GIBS Data
Real-time satellite imagery
NDVI Analysis
Vegetation health tracking
3D Globe View
Interactive exploration
Climate Data
Annual temperature trends
Interactive Globe
NASA Data
Data Visualization
Coverage
The Challenge
Witness the pulse of life across our planet! From season to season and year to year, Earth's vegetation is constantly changing, providing critical information on plant species, crops, seasonal effects, pollen sources, and changes in plant phenology (the relationship between seasonal changes and climate and biological phenomena in plants).
Your challenge is toharness the power of NASA Earth observations to create a dynamic visual tool that displays and/or detects plant blooming events around the globe—just like pollinators do—and that advances solutions for monitoring, predicting, or managing vegetation.
Our Solution
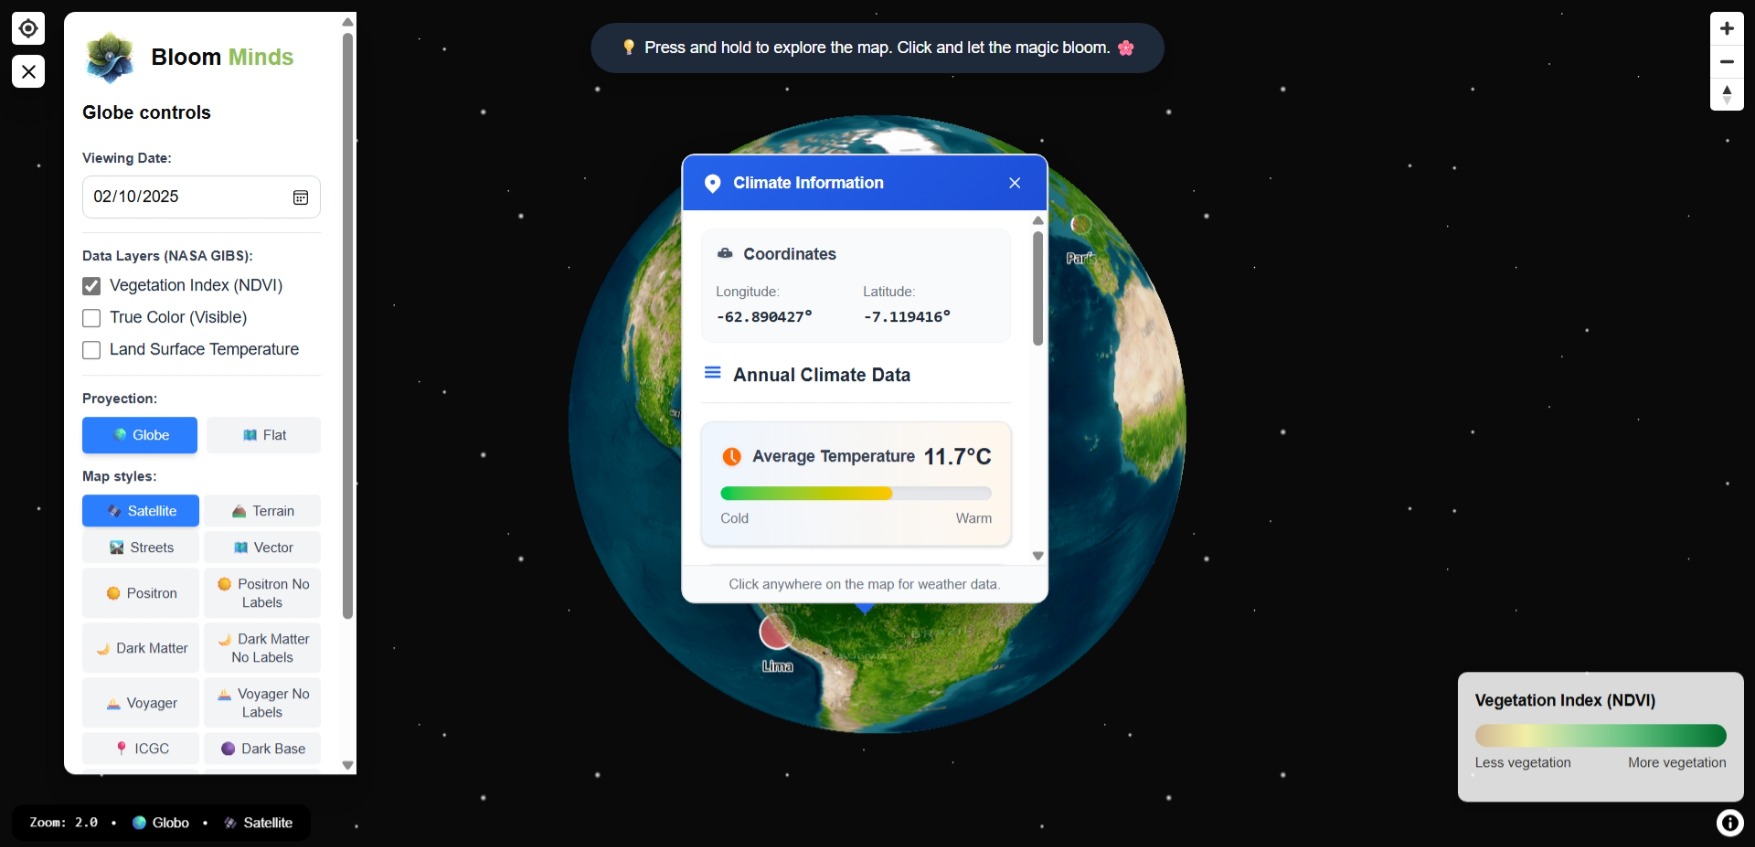
BloomMinds presents Bloom Explorer, an interactive 3D platform that visualizes the globe and leverages NASA's GIBS data to track vegetation changes and flowering events in near real-time. Additionally, we offer Bloom Quiz, an educational experience designed to learn about vegetation, flowering cycles, and plant pollination.
NASA GIBS Integration
Real-time access to NDVI, surface temperature, and true-color satellite imagery from NASA.
Interactive 3D Globe
Explore vegetation data worldwide with multiple projections and dynamic map styles.
Bloom Quiz
Learn about phenology, pollination, and biodiversity through an interactive quiz experience.
Bloom Game
Play "🌿 THE LAST BOTANIST" and restore life to a dying Earth.
Key Features
NDVI Vegetation Index
Visualize vegetation health and density using the Normalized Difference Vegetation Index, with color-coded overlays showing areas of high and low vegetation activity.
Multi-Layer Data Visualization
Toggle between different NASA GIBS data layers including true color imagery, surface temperature, and vegetation indices to gain comprehensive insights.
Time-Series Analysis
Track vegetation changes over time with date selection controls, enabling the detection of blooming events and seasonal patterns across different regions.
BloomMinds Team
Five passionate innovators united by the mission to visualize Earth's vegetation. 🌍✨
TATIANA CENTURIÓN
PROJECT LEADER
JHAZMÍN HUAMÁN
UI/UX DESIGNER
JORDAN FERNÁNDEZ
FULL STACK DEVELOPVER

PABLO BURGOS
FULL STACK DEVELOPVER
GYNO ROMERO
DATA ANALYST